Exploratory Data Analysis
We often come across a situation where we want to analyze a dataset, we are looking for an answer of how several input parameters are affecting the final output of the process. First step in this process to have a dataset, if not then we need to generate datasets either by carrying out surveys or if we are doing out an experiment then we can generate simulated data from the computational software’s like COMSOL, ANSYS and Simulink. Once we have a dataset then we can proceed for EDA(exploratory data analysis) to answer common questions pertaining to the data.
Exploratory Data Analysis
In simple term, EDA refers to performing visualization and identifying information’s and pattern about the dataset. This information can be anything such as a pattern or tread in the dataset, missing values, correlation coefficients between the parameters and potential outliers. These features are important for our hypothesis testing and coming out with a probabilistic model which can help a firm in increasing sales and profit from their products. In other way, EDA can be considered as a potential way to reveal information beyond formal modeling and hypothesis testing. Originally developed by an American scientist in 1970s, now one of the most powerful tools in data science and Machine learning field.
Now when we are discussing about EDA it is also important that you should know the importance of EDA. In general. data scientists use this tool to corroborate the outcome and their applicability in desired business goals. Additionally, it also helps stakeholder to check if they are taking a right decision or not. Once we are done with EDA, the outcome can be a raw data for building machine learning models.
Type of EDA
- Univariate non-graphical
Simplest type of data analysis where we analyze a single variable. Because univariate has a single variable we are not bothered to think about causation or correlation. The main purpose is to find a pattern and describe the data.
-Univariate graphical
Graphical tools are key for exploratory data analysis, common types of methods are box plot, stem-leaf, histogram plot
-Multivariate, non-graphical
Multivariate non graphical generally show the relationship between two or more variables through statistical techniques
Multivariate, graphical
This is used to develop a relationship between two or more variables. Mostly for multivariate analysis we use bar chart, scatter, heat map and bubble plot.
Before EDA(Exploratory Data Analysis)
Before starting an EDA, one should ask to the purpose of the experiment or the data i.e., understanding at high level. Based on the type of insights you want from the dataset the type of EDA might differ. Once you have the high-level understanding then your focus must shift to understand more about the dataset i.e., number of columns and rows in the dataset, size of dataset. Is the size too big, do we need additional computational power to process the dataset, you should have idea of such question before jumping into EDA.
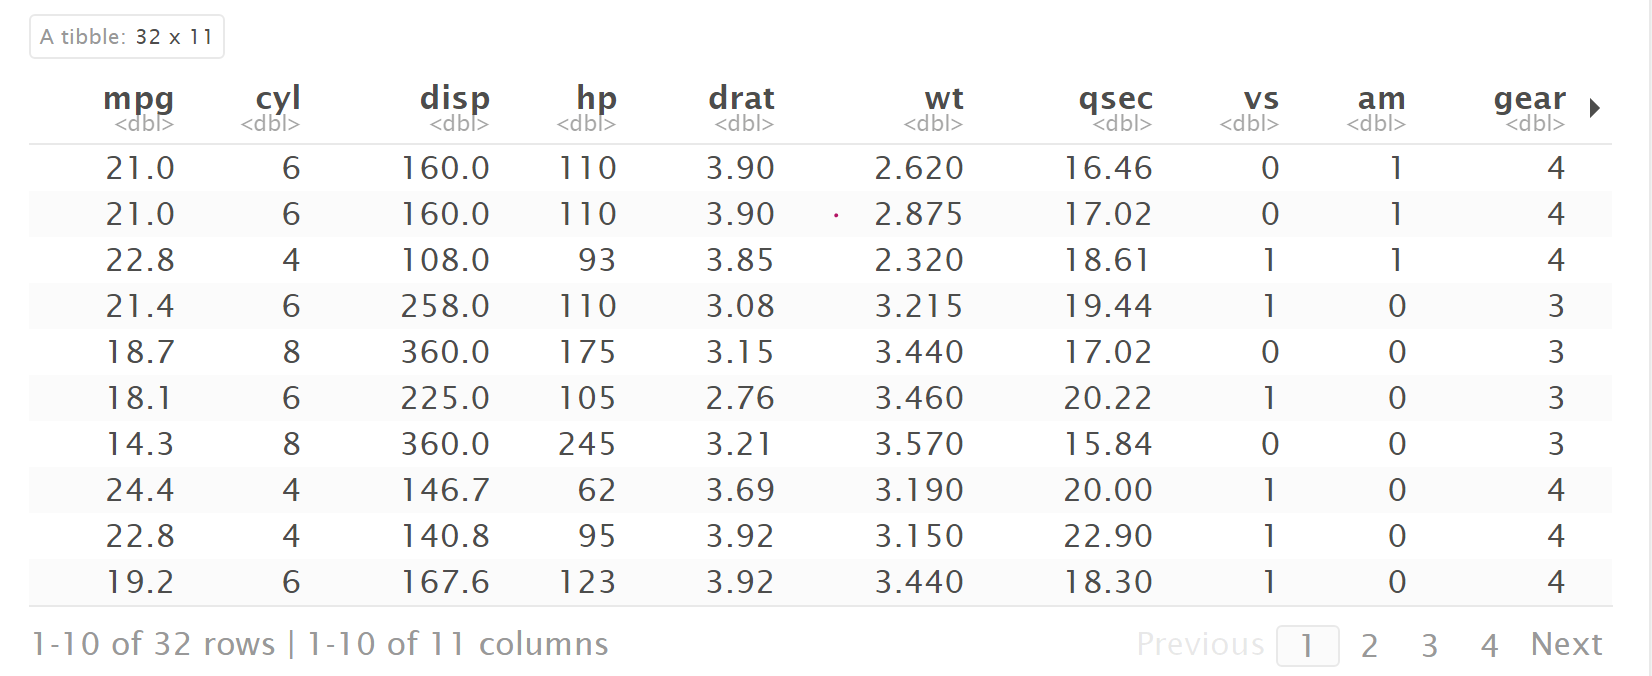
Below I have attached mtcars dataset from the R in built datasets. We can see that the dataset has 32 rows and 11 columns.
Performing EDA
EDA can be performed in multiple way, few methods are included below:
Missing Data
You should start the exploratory data analysis with exploring if dataset has any missing value or not. If dataset has large number of input features, it is useful to count the number of missing values and visually plot them. In ‘mtcar’ dataset no missing value reported.
sum(is.na(mtcars))
Just consider an ideal scenario when our dataset has more than 50% missing values. For such kind of sparse dataset one possible solution can be to exclude the dataset from the main dataset. But if we simply remove the dataset then there is high possibility that we introduce a bias in our dataset. So, handling missing data is not a straight forward case, to understand more you can explore more about a separate branch of statistics called ‘Imputation.’
Summary Statistics of Data
At this point you will have idea about the missing values in the dataset still you don’t have much idea about each feature columns available in the dataset. Potentially you need to have information like type of variable (continuous, discrete, or categorical), mean, median, IQR, min and max value for the respective columns. This information will help in identifying type of visualization you can use to represent the data.
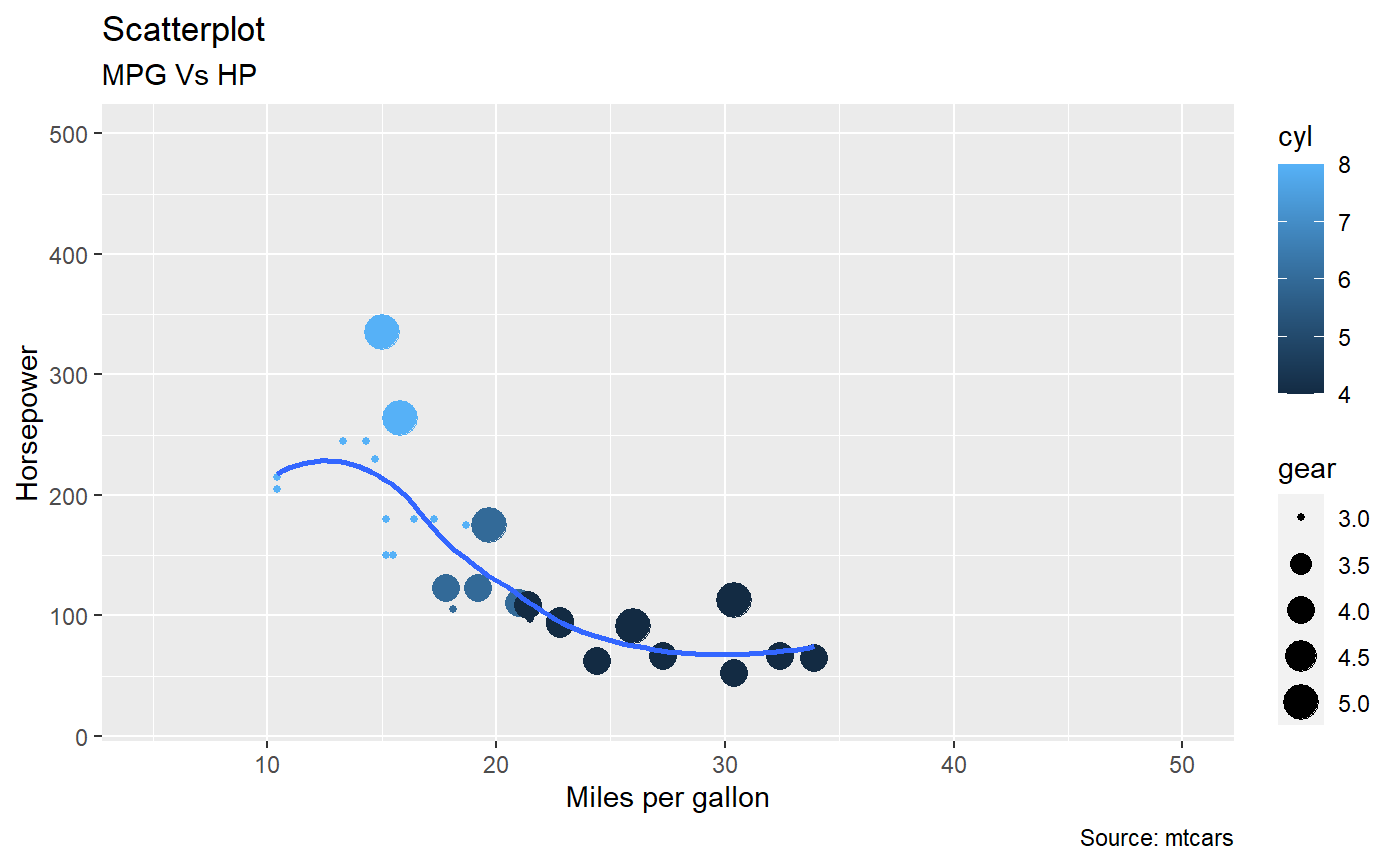
Correlation coefficient can be your best tool, it will give you information the relationship between two variables. Just consider we want to visualize the correlation between two continuous feature column, the best way is to plot them and calculate Pearson correlation coefficient.
# scatter plot between mpg and hp
gg <- ggplot(df, aes(x=mpg, y=hp)) +
  geom_point(aes(col=cyl, size=gear)) +
  geom_smooth(method="loess", se=F) +
  xlim(c(05, 50)) +
  ylim(c(20, 500)) +
  labs(subtitle="MPG Vs HP",
       y="Horsepower",
       x="Miles per gallon",
       title="Scatterplot",
       caption = "Source: mtcars")

plot(gg)
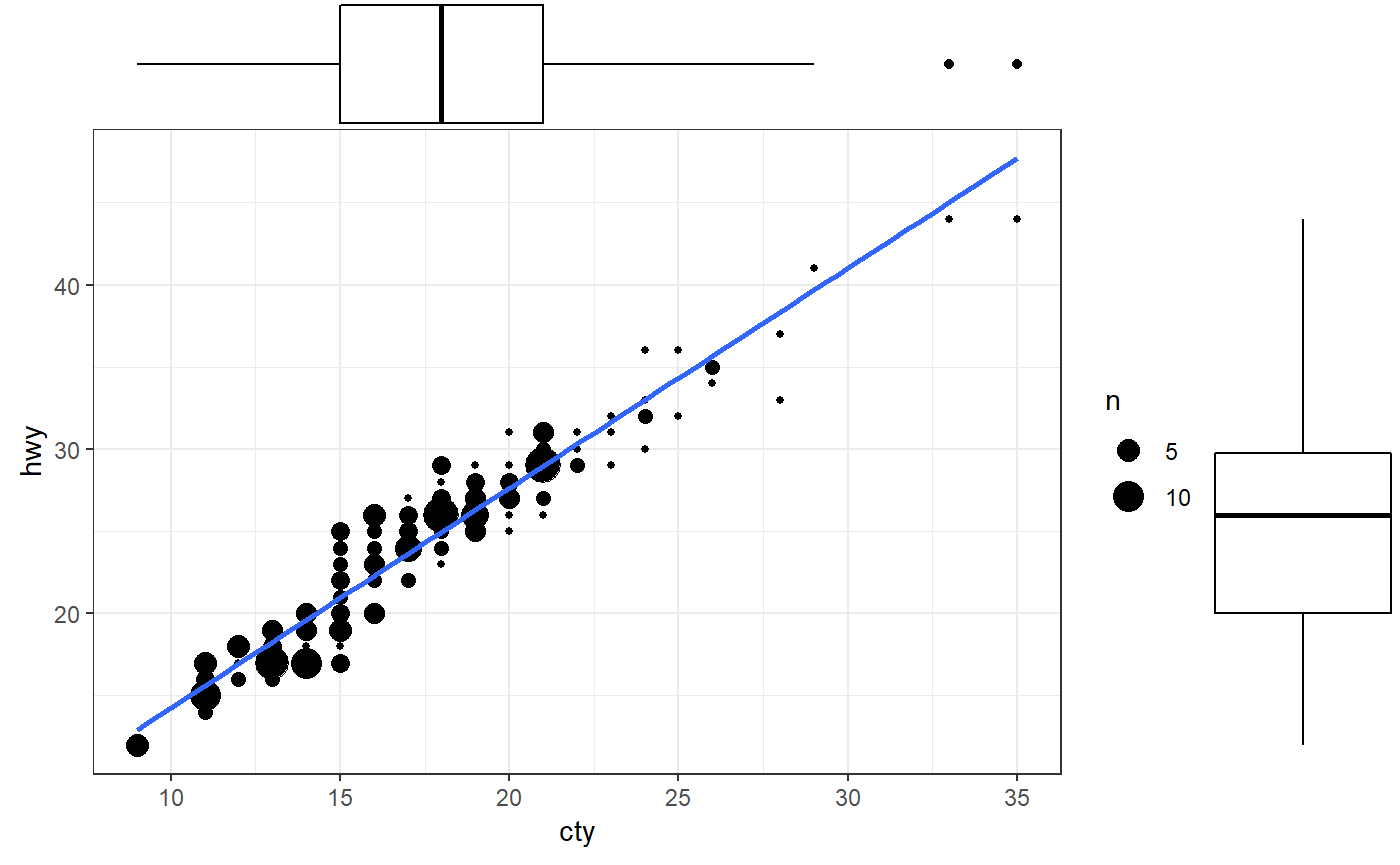
Box plot can be your other tool to carry out EDA with the data. Finding out outlier in your dataset is a crucial step as that will decide the type of central tendency you want to decide for the dataset. There can be multiple reason for an outlier in the dataset, one potential reason can be incorrect data accumulation. handling outlier is a tricky process but to visualize the data with outlier we can use box plot.
library(ggExtra)
data(mpg, package="ggplot2")

theme_set(theme_bw())  # pre-set the bw theme.
mpg_select <- mpg[mpg$hwy >= 35 & mpg$cty > 27, ]
g <- ggplot(mpg, aes(cty, hwy)) +
  geom_count() +
  geom_smooth(method="lm", se=F)
ggMarginal(g, type = "histogram", fill="transparent")
ggMarginal(g, type = "boxplot", fill="transparent")
Exploratory Data Analysis Tools
Two most common programming languages used for EDA includes:
Python
Python is a high-level object orientated programming with built-in data structure make it very attractive for rapid application development and scripting language.
R
R is an open source programming language and provides free software environment for statistical computing. R language is widely used by all statisticians in data science for data analysis.
Personally, I prefer R for data analysis than Python.