Working With Apis
EDA With NASA APIs
This project is based on accessing data from APIs and eventually performing analysis on them. For this project, I have Asteroid data information from NASA API. This API has only one end point and two modifications. Th user can input a start and a end date and the API will retrieve data from the server between two date range. Final project can be found at Link
I have used multiple R packages for this project, few of them are listed below:
- httr - For web API
- jsonlite - mapping json and R data
- lubridate - to handle dates in the data
- ggplot - for visualization
After carrying EDA on the asteroid data following insights were discovered:
- The median diameter of non-hazardous asteroid is less than the median diameter of hazardous asteroid.
- For a relative velocity less than 37000 kilometer/hr. all asteroid were categorized as non-hazardous
- The NASA API has almost 99% asteroid data and only 1% comet.
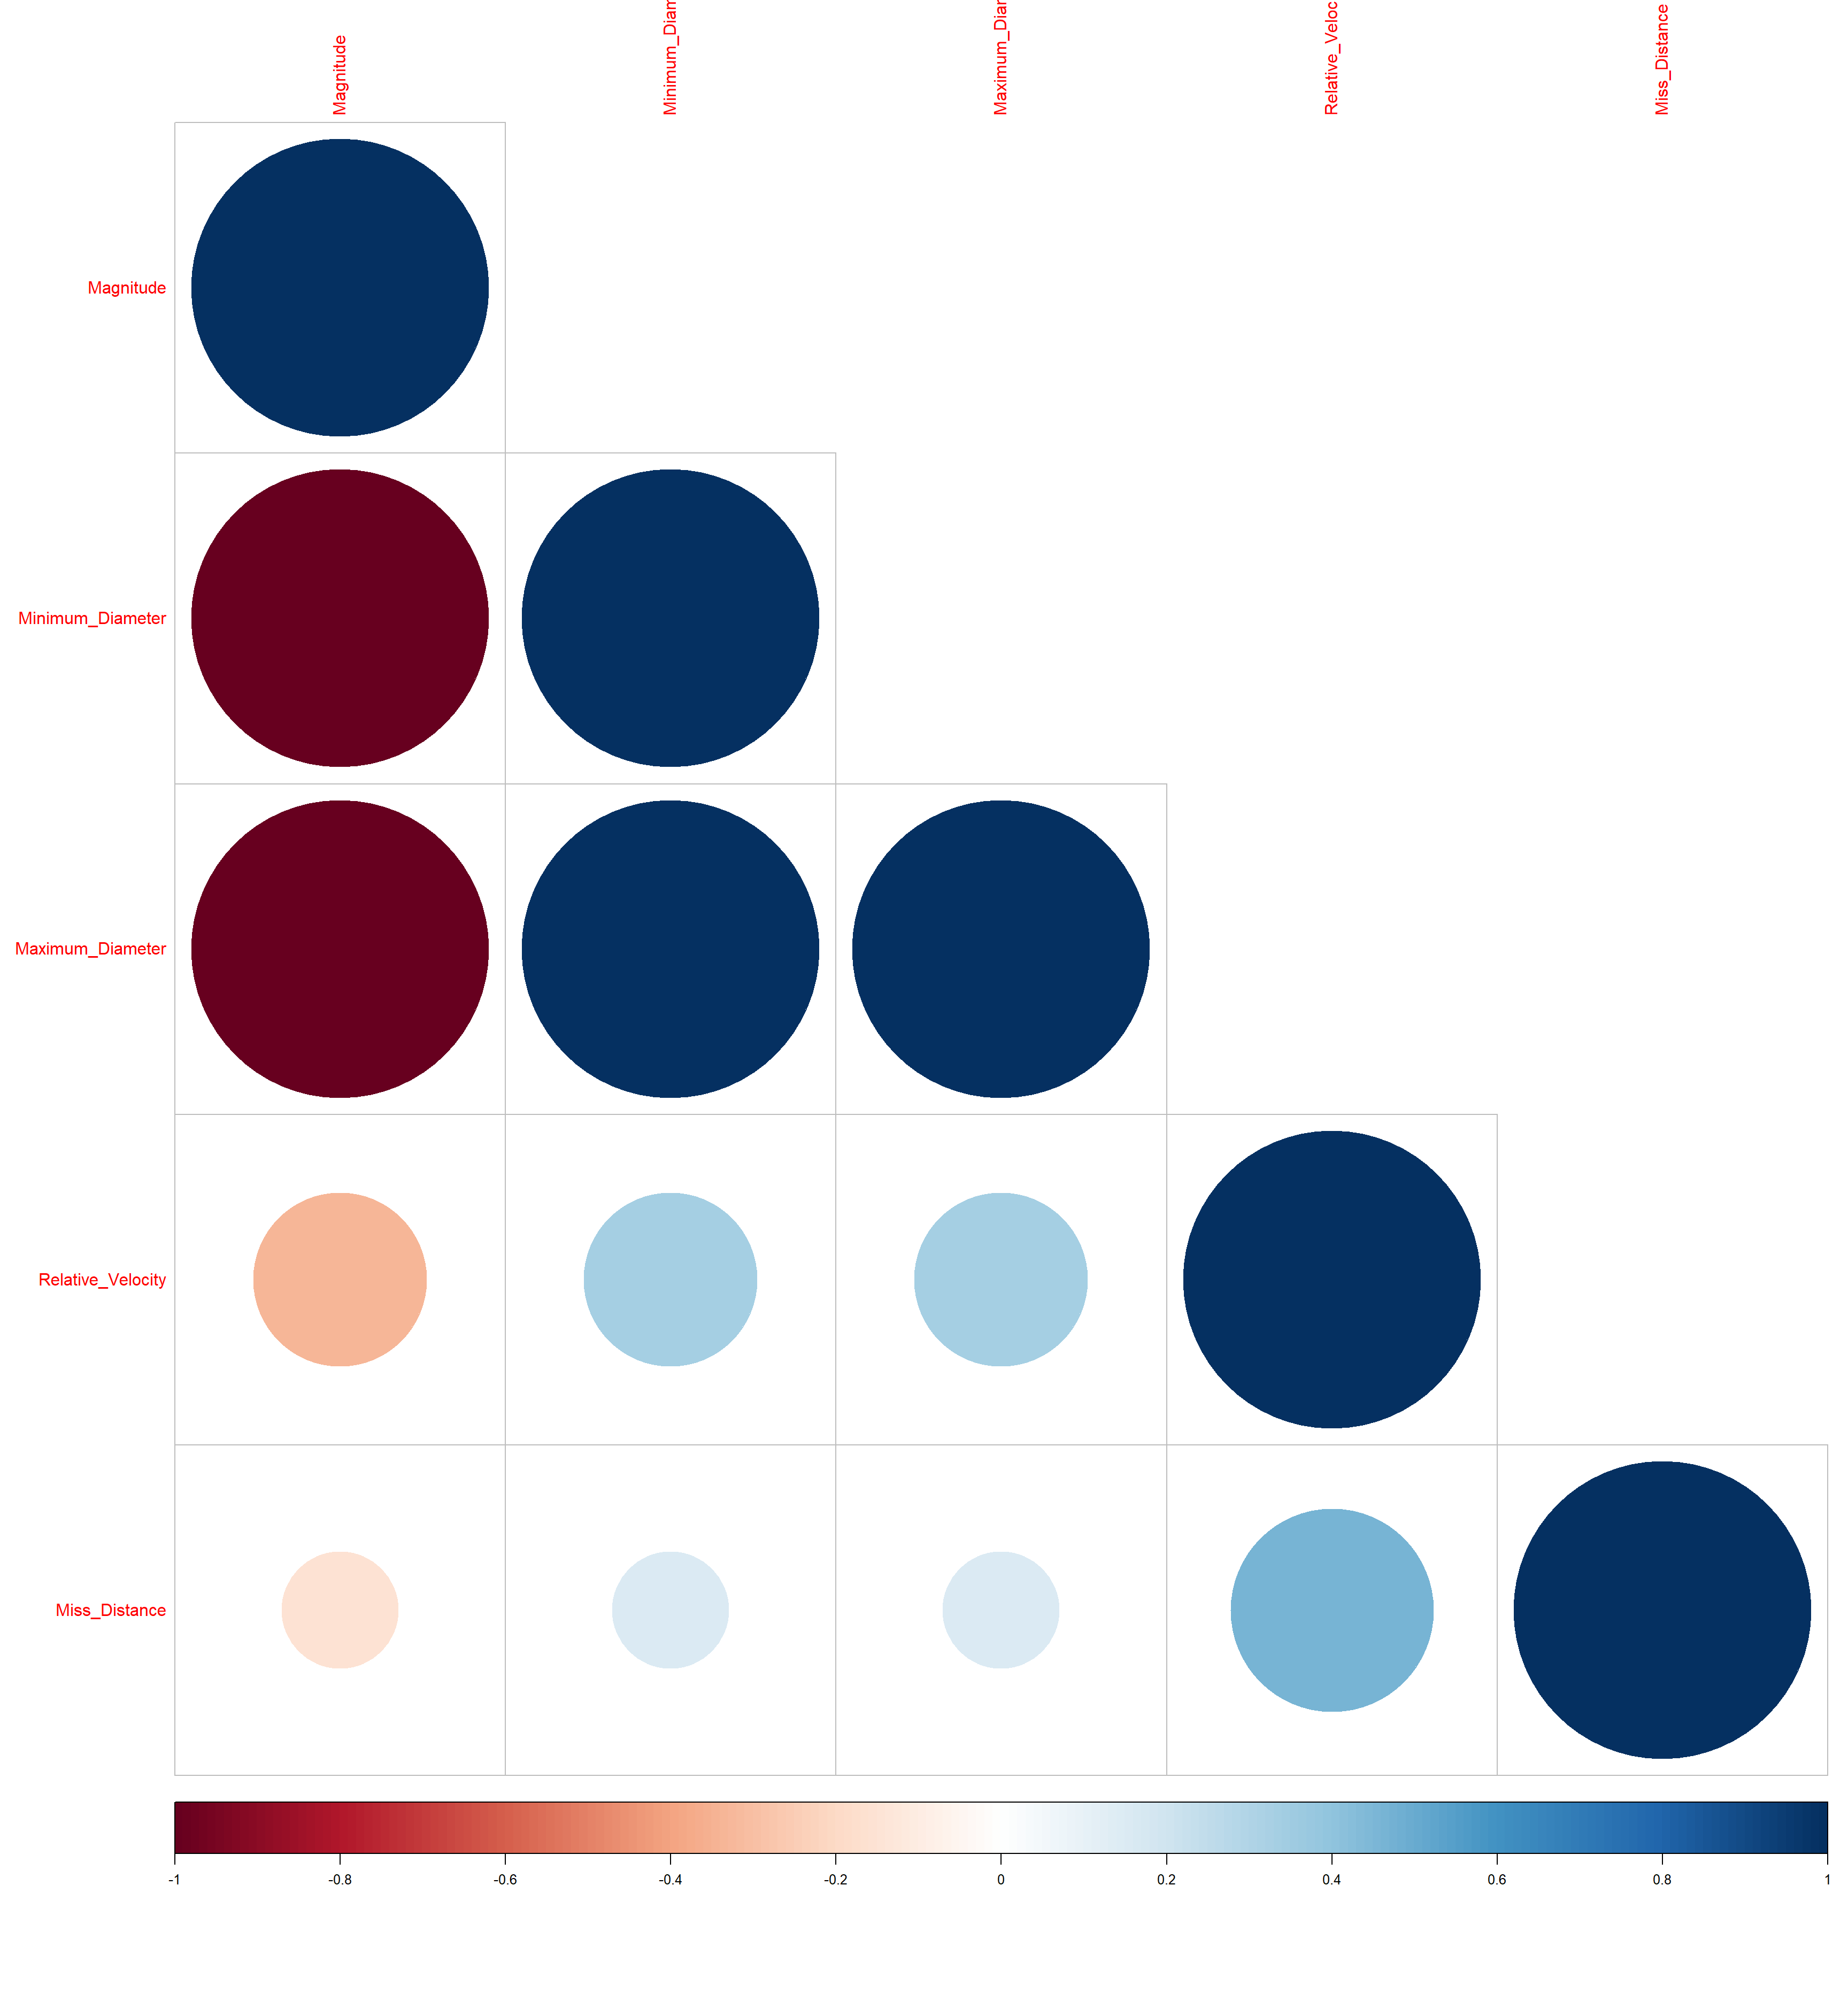
A correlation map is also generated to understand the relationship among the variables.
Project Workflow
The first step in data manipulation is to get data. We can get data from a csv file, a SAS dataset, or from a API. To retrieve data from API we use GET request, in R GET request handled by httr package. The data was stored in a nested dictionary format, so I need to go through nested dictionary to get desired data from the json file. Once data available one need to check if the data has any missing value and the data type so that pre processing can be applied on the dataset. In Asteroid dataset there was no missing value but the dates and other numerical features were in string format. SO to convert them into desired format I utilized the concept of explicit coercion. Once data available in correct format we can step toward EDA.
The EDA part consist of generating a new column based on the existing input columns and them applying statistical technique to interpret and generate some finding from the data. For EDA visualization is a big tool, and in my project I have used ggplot package from R library.
Challenges and Future Approach
The biggest challenge for me to select right data for the analysis. In my case Asteroid has very limited numerical features for the analysis only [77x8] data points. Other challenge was to get data and convert them into a feature vector was a challenge. As discussed, the Asteroid dataset has very limited numerical feature columns and most of these columns are nested deep inside the json file. To correctly understand the json structure and then apply chaining to get desired feature column was a challenge. In future projects, I will put more effort on the right dataset and EDA selection approach, so that I can analyze the data in a better way.